Prometheus 远端存储 InfluxDB 部署
Prometheus 远端存储 InfluxDB 部署
1.部署 InfluxDB 时间序列数据库
官方文档: https://docs.influxdata.com/influxdb/v1.7docker run -d \
--name influxdb \
-p 8086:8086 \
-v /data/project/influxdb/data:/var/lib/influxdb \
linuxhub/influxdb:1.7.7
1.1.创建管理员权限用户
# docker exec -it influxdb influx |
1.2. 开启身份认证
[http] |
1.3. 创建 监控服务账号密码数据
# docker exec -it influxdb influx -username=ops -password=12345678 |
2. 部署 Prometheus 监控服务
官方文档: https://prometheus.io/docs/prometheus/2.11/storage
# author: linuxhub
configure_file=/data/project/prometheus/conf
prometheus_data=/data/project/prometheus/data
chown -R 65534:65534 ${configure_file}
chown -R 65534:65534 ${prometheus_data}
docker run -d \
--name prometheus \
--restart=always \
-p 9090:9090 \
-v ${configure_file}:/etc/prometheus \
-v ${prometheus_data}:/prometheus/data \
linuxhub/prometheus:v2.11.2 \
--config.file=/etc/prometheus/prometheus.yml \
--storage.tsdb.path=/prometheus/data \
--web.enable-lifecycle
配置文件:conf/prometheus.yml# my global config
global:
scrape_interval: 15s # Set the scrape interval to every 15 seconds. Default is every 1 minute.
evaluation_interval: 15s # Evaluate rules every 15 seconds. The default is every 1 minute.
# scrape_timeout is set to the global default (10s).
# 远端存储 数据连接
remote_write:
- url: "http://10.10.2.100:8086/api/v1/prom/write?db=prometheus_db&u=prometheus_user&p=12345678"
remote_read:
- url: "http://10.10.2.100:8086/api/v1/prom/read?db=prometheus_db&u=prometheus_user&p=12345678"
# Alertmanager configuration
alerting:
alertmanagers:
- static_configs:
- targets:
# - alertmanager:9093
# Load rules once and periodically evaluate them according to the global 'evaluation_interval'.
rule_files:
# - "first_rules.yml"
# - "second_rules.yml"
# A scrape configuration containing exactly one endpoint to scrape:
# Here it's Prometheus itself.
scrape_configs:
# The job name is added as a label `job=<job_name>` to any timeseries scraped from this config.
- job_name: 'prometheus'
# metrics_path defaults to '/metrics'
# scheme defaults to 'http'.
static_configs:
- targets: ['localhost:9090']
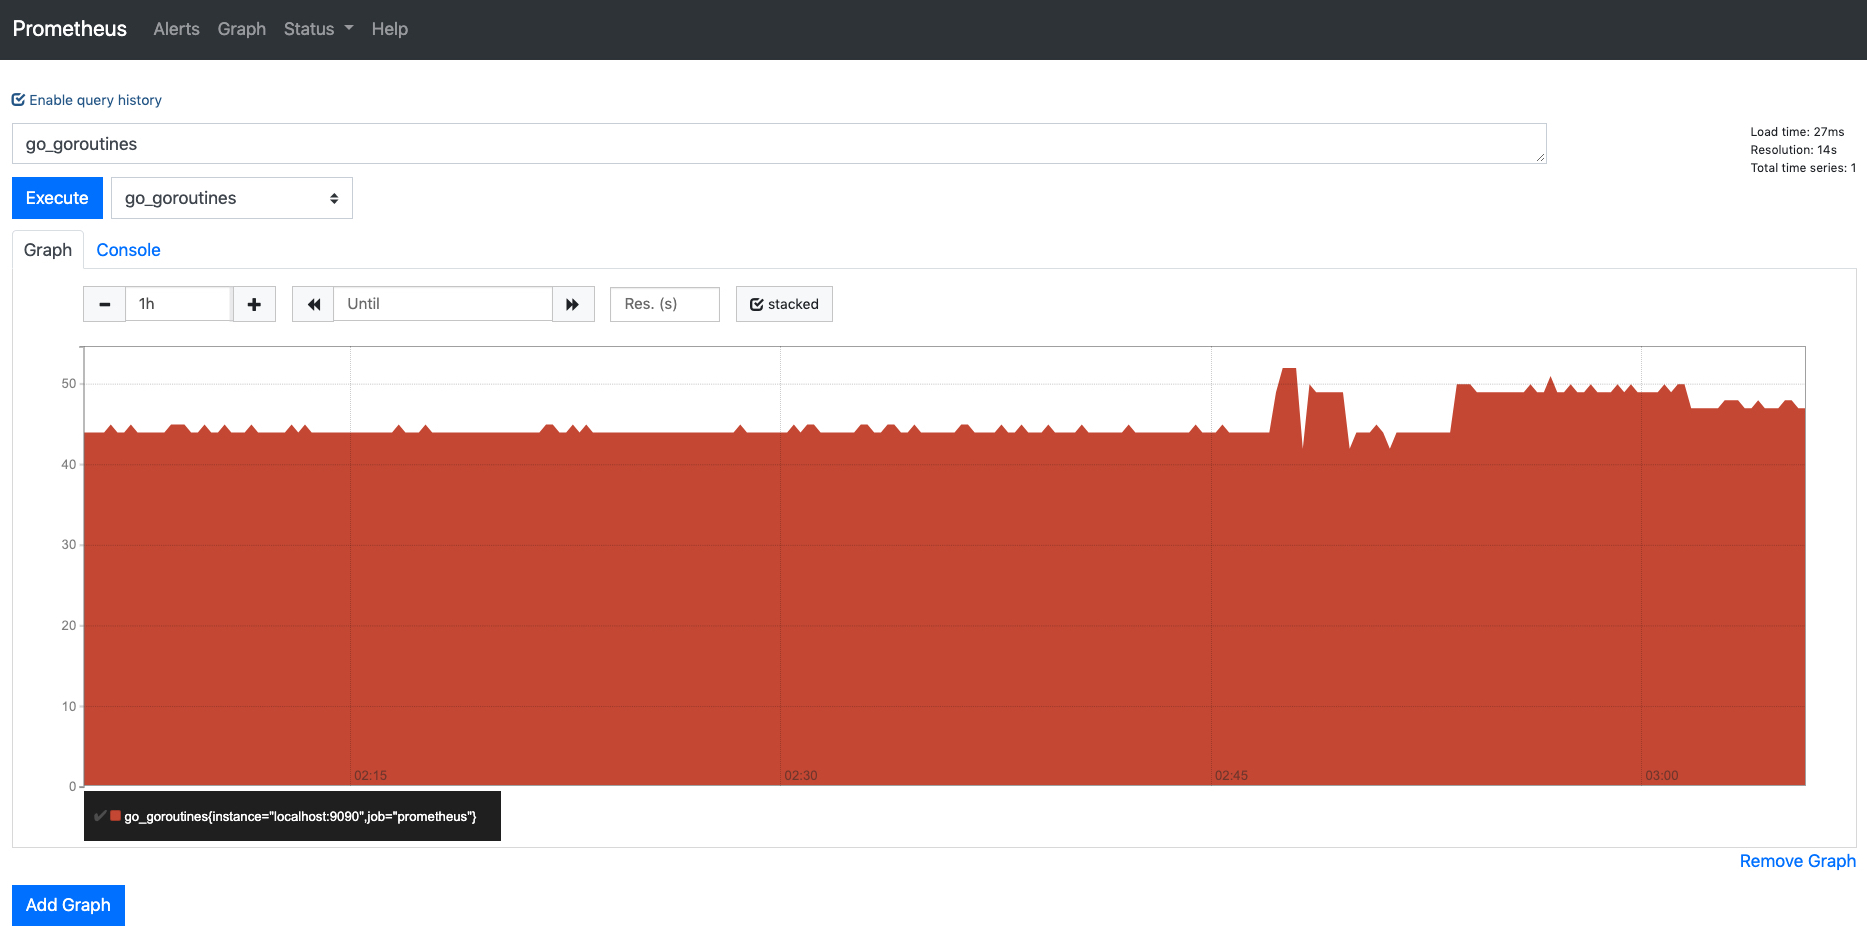
访问地址:http://{IP}:9090
3.部署 chronograf 时序数据可视化
官方文档:https://docs.influxdata.com/chronograf/v1.7docker run -d \
--name chronograf \
-p 8888:8888 \
-v /data/project/chronograf/data:/var/lib/chronograf \
linuxhub/chronograf:1.7.12
访问地址: http://{IP}:8888

本文作者 : 泽泽
原文链接 : http://www.linuxhub.cn/2019/08/20/prometheus-influxdb.html
版权声明 : 本博客所有文章除特别声明外,均采用 CC BY-NC-SA 4.0 许可协议。转载请注明出处!
知识 & 情怀 | 二者兼得